


COMMERCIALIZE · PROVIDER INTELLIGENCE
Know which physicians to build for, and be championed by.
Finding the physicians to work with is less a market-size question than a question of disposition: what each provider actually does, says, aligns with, and publishes. We build a comprehensive, current source of provider disposition on the same data that powers our regulatory platform.
THE METHOD
A provider is legible from many angles.
No single source is complete. Each lens catches something the others miss—together they identify the experts, the heavy users, and the influential voices.
Procedures
CMS Medicare Part B claims show what a provider actually does, and for whom—so you can see who is practicing rather than merely present.
Publications
PubMed papers and how often they are cited indicate academic credibility and a body of published work.
Trials
Principal-investigator roles on ClinicalTrials.gov—with their sponsors and FDA clearances—surface the rising investigators.
Industry Ties
Open Payments and the NPPES registry reveal the payment and roster relationships that show who is already aligned with whom.
Influence
Social presence, reach, and sentiment—including what a provider posts about devices and companies—show whose voice actually carries.
THREE PHYSICIANS, THREE SHAPES
The same five lenses redraw a very different provider.
Watch one provider's disposition morph into the next—the shape is the whole point. Any single lens would miss two of the three.
The High-Volume Operator
High procedure volume, little published — found only by looking at claims.
WORKED EXAMPLE
Emergency medicine & point-of-care ultrasound
Billing alone would rank a top physician near the bottom. Point-of-care ultrasound is bundled into the facility fee, so the procedures lens is nearly blind here—layer in publications, trials, and industry ties and the same person resolves into a key opinion leader.
bill any ultrasound to Medicare.
Point-of-care ultrasound is bundled into the facility fee, so 98% of the field is invisible in claims. Publications, trials, industry ties, and influence are how you find the other 45,000.
WHERE A SPECIALTY CONCENTRATES
A map of where to launch first.
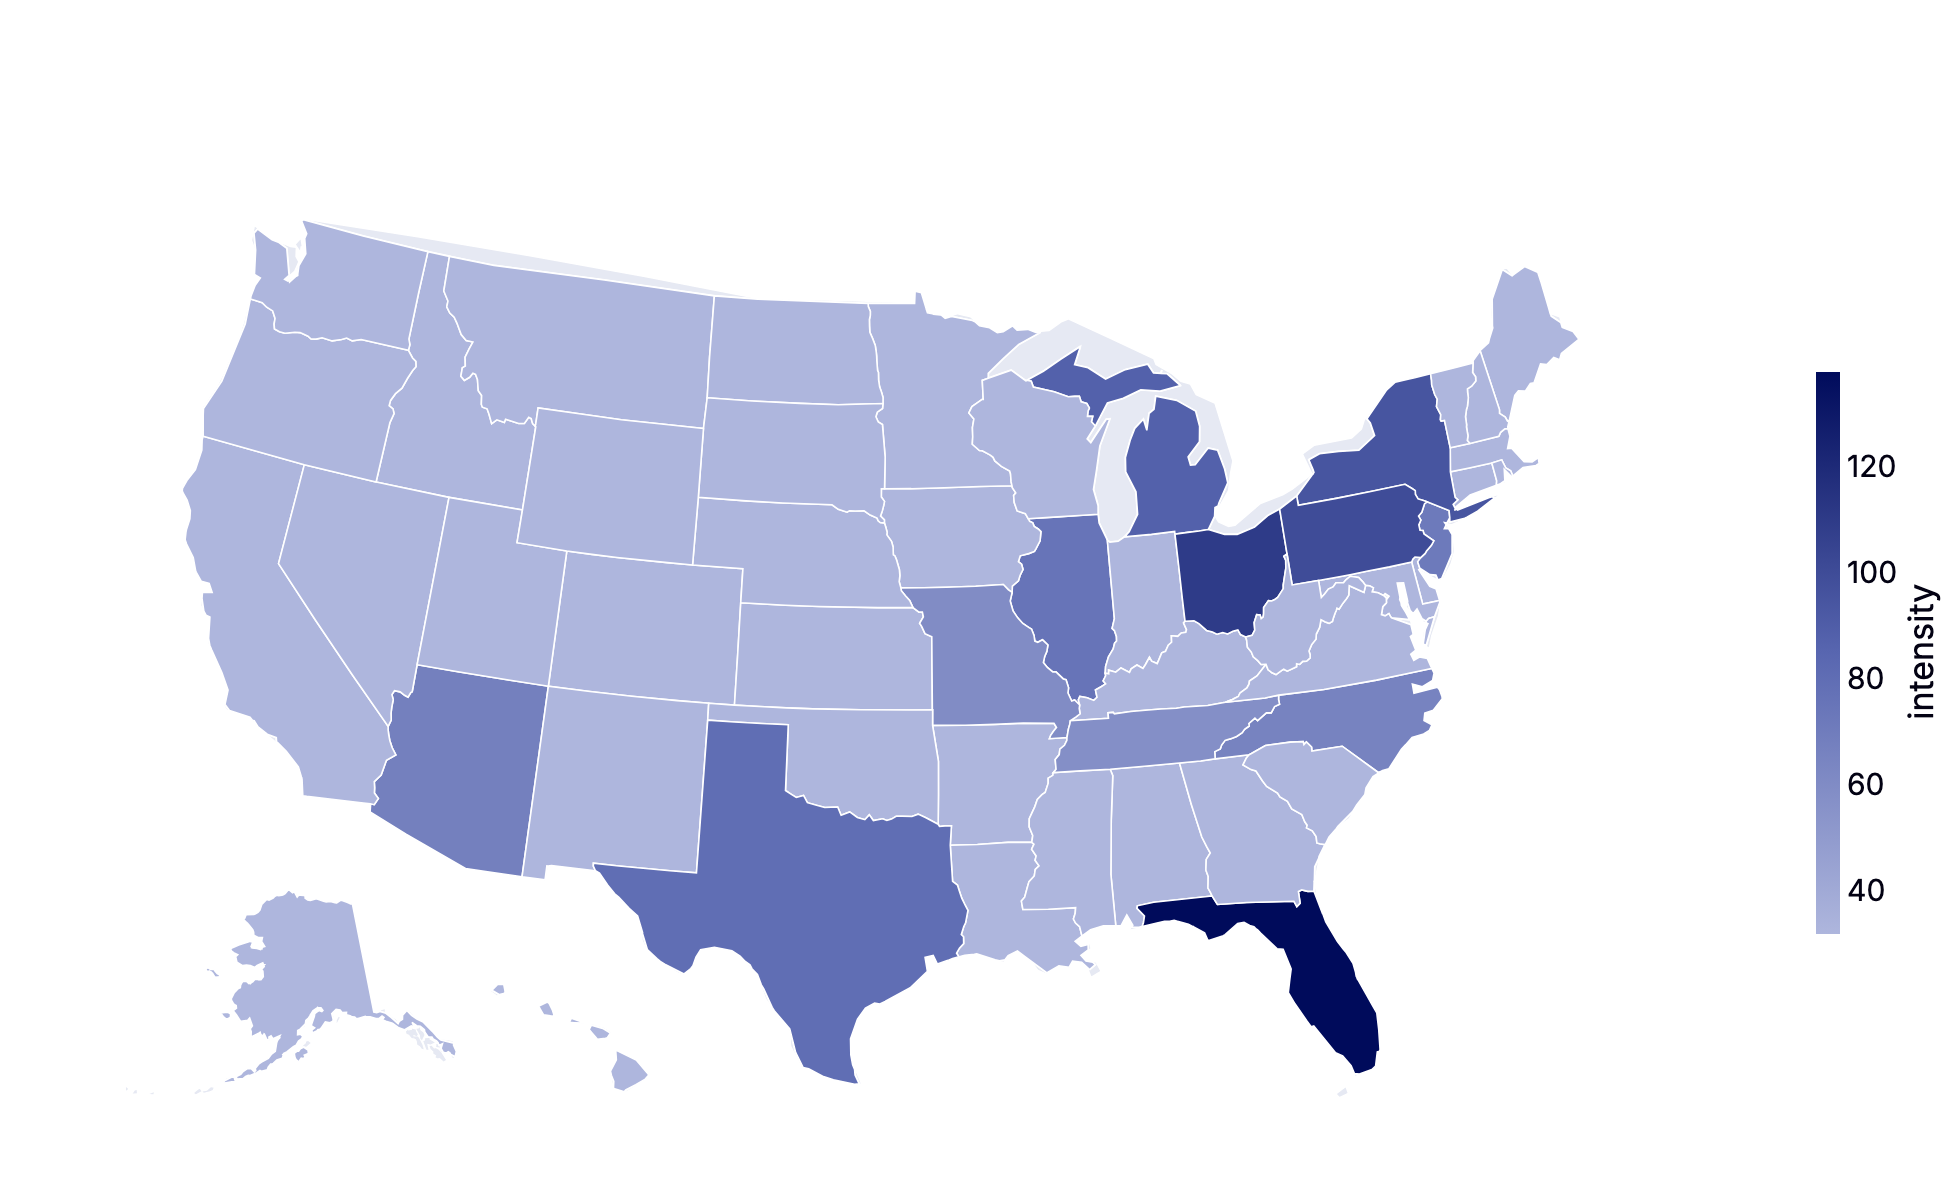
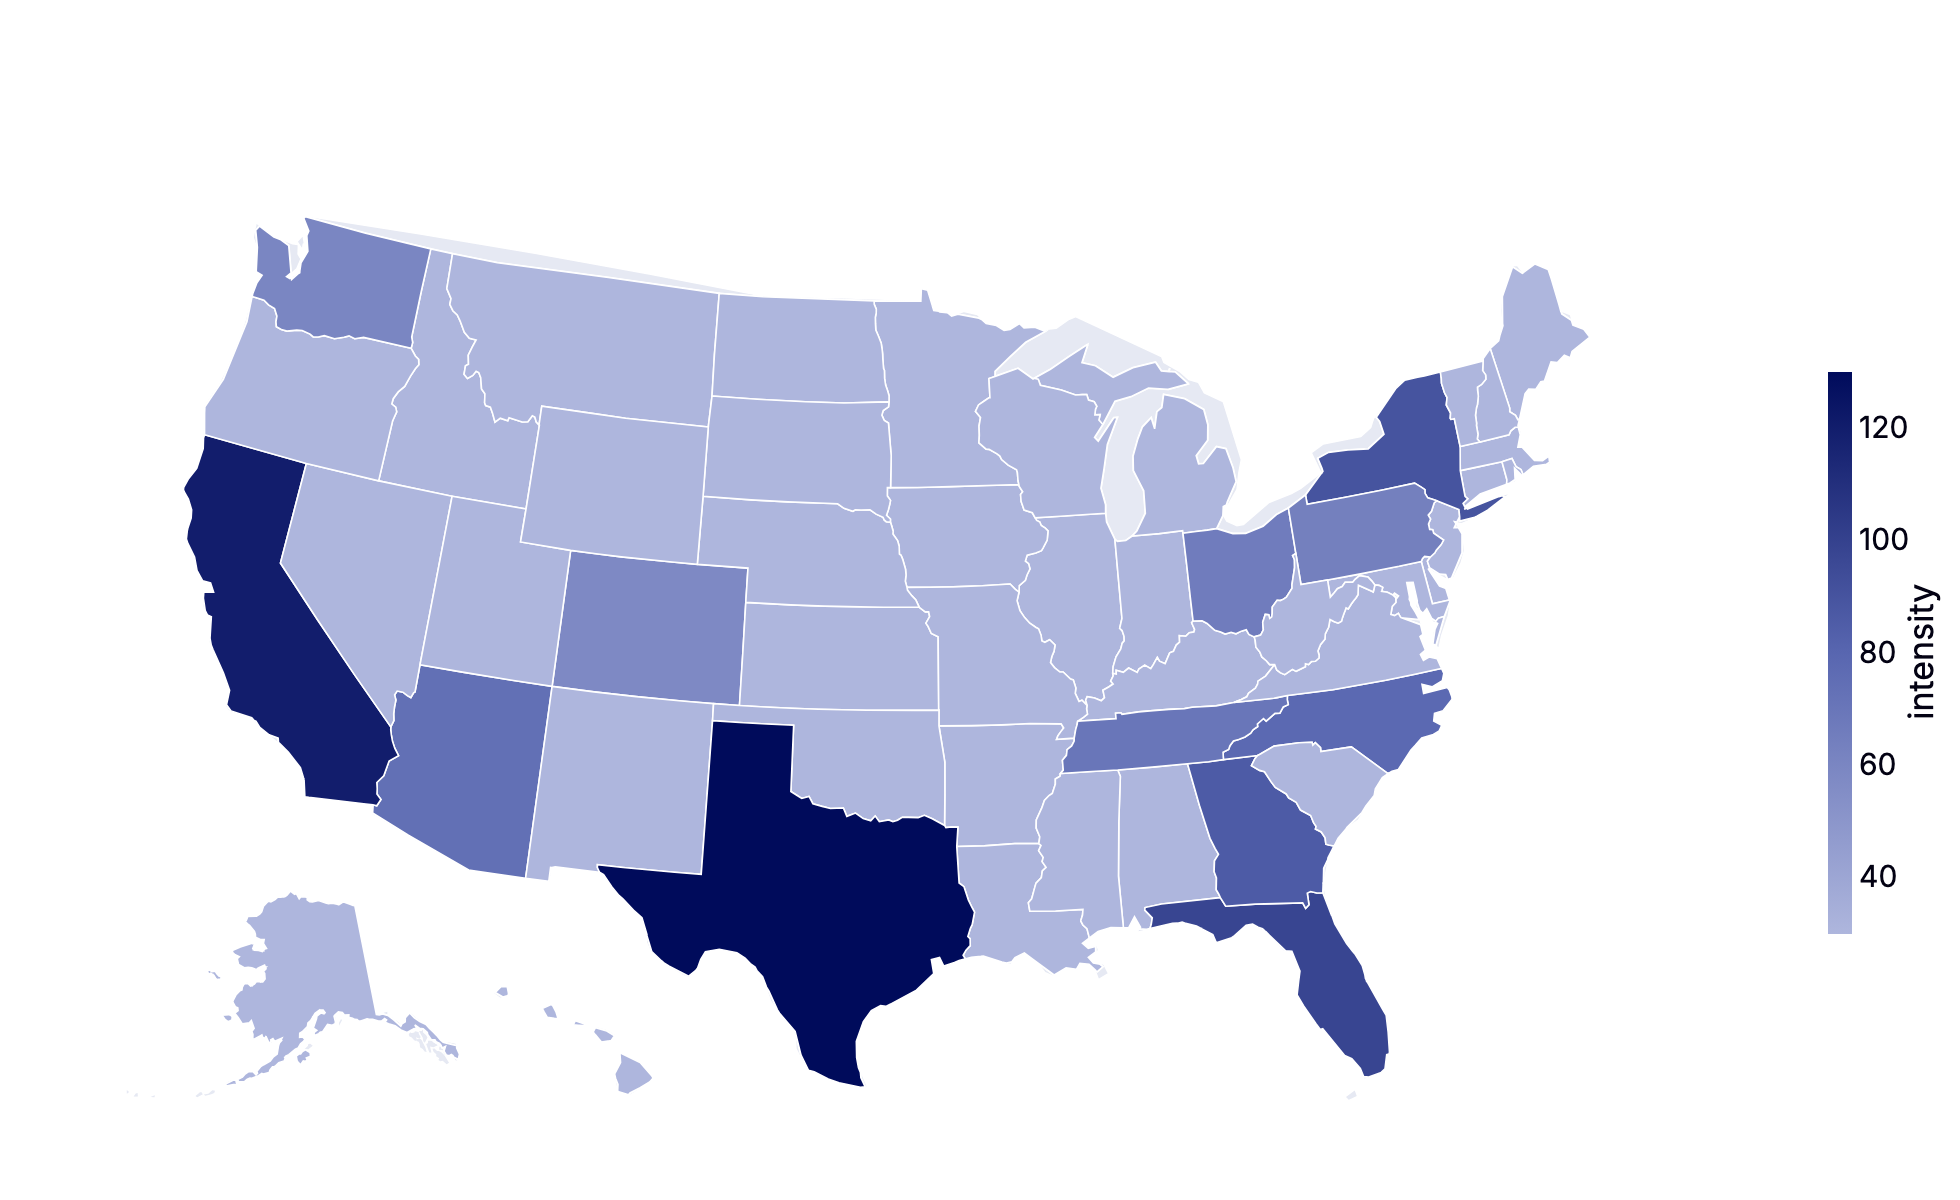
The same billing data, read geographically: where a specialty's practice is most intense per provider. Watch the hot-zones move as the specialty rotates—or pick one.
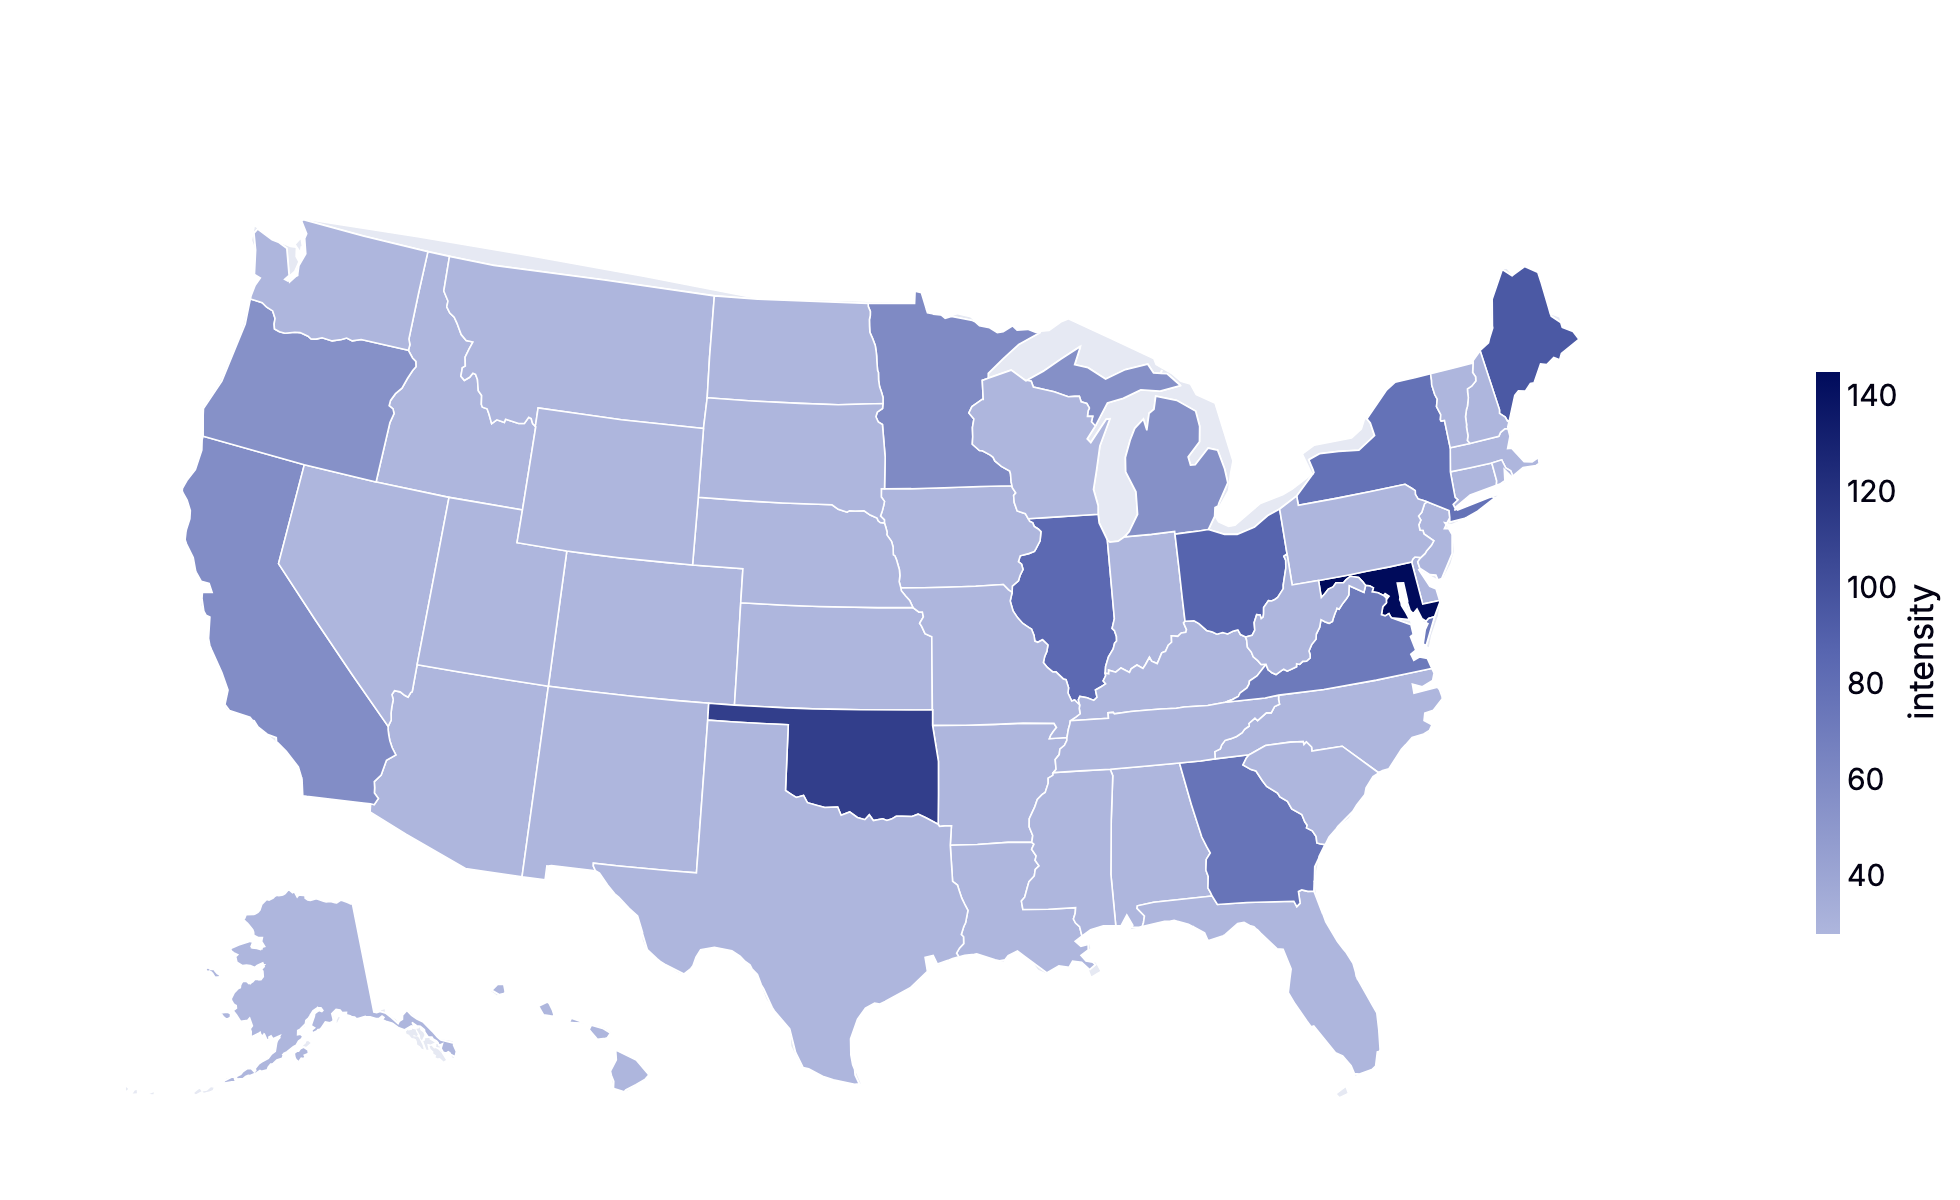
- Hottest states
- Maryland 145
- Oklahoma 112
- Maine 95
- Ohio 88
- Illinois 84
Intensity is per provider, not raw volume—so it points to where the practice pattern is densest, not just where the most physicians are. From here you drill to the metros and the named providers behind each hot-zone.
HOW WE ENGAGE
We already hold the data, and customize around your use case.
Each phase scopes the next.
Scope
We align on your priority markets, specialties, and the job to be done. It is short, and it defines the proof-of-value deliverable.
Proof of value
We deliver one specific, useful asset—for example, the credibility-scored provider list behind a named launch or sales motion—in weeks.
Live feed
We stand up a refreshing feed that tracks providers as launches and markets evolve, delivered into your commercial and medical teams' tools.
Which providers matter for your next launch?
Tell us your market and specialty—we'll show you what provider disposition looks like.